184.[HarmonyOS NEXT 实战案例十:Grid] 仪表板网格布局基础篇
[HarmonyOS NEXT 实战案例十:Grid] 仪表板网格布局基础篇
项目已开源,开源地址: https://gitcode.com/nutpi/HarmonyosNextCaseStudyTutorial , 欢迎fork & star
效果演示
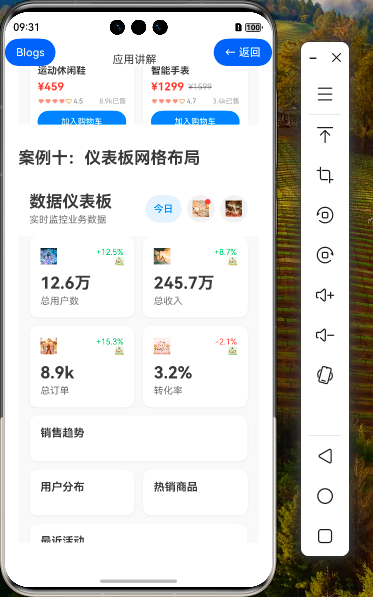
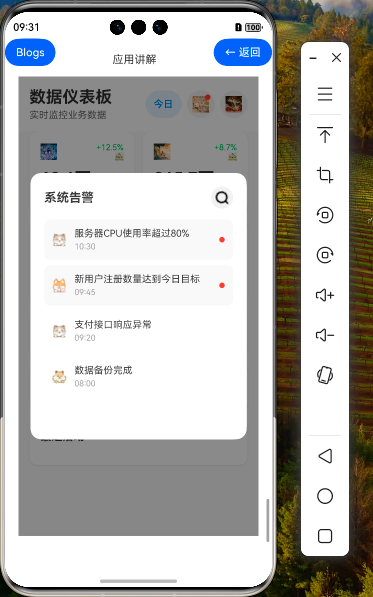
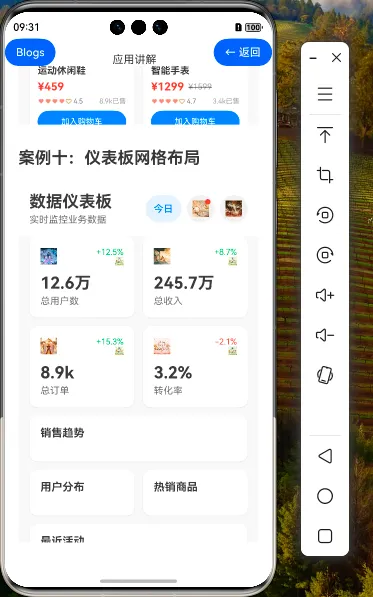

1. 引言
在企业级应用开发中,仪表板(Dashboard)是展示关键业务数据和指标的重要界面,它能够帮助用户快速了解业务状况并做出决策。HarmonyOS NEXT 提供的 Grid 组件具有强大的布局能力,非常适合构建复杂的仪表板界面。本教程将详细讲解如何使用 Grid 组件实现一个功能完善、布局合理的企业级仪表板界面。
2. 仪表板概述
2.1 仪表板的特点
企业级仪表板通常具有以下特点:
- 数据可视化:通过图表、数字卡片等方式直观展示数据
- 信息层次分明:将信息按重要性和关联性进行分组
- 交互性强:支持筛选、刷新、查看详情等操作
- 响应式布局:适应不同屏幕尺寸和方向
- 实时更新:能够定期或实时更新数据
2.2 实现功能
本教程将实现的仪表板功能包括:
- 数据概览:展示关键业务指标(用户数、收入、订单数、转化率)
- 数据图表:销售趋势图、用户分布图
- 数据列表:热销商品排行、最近活动记录
- 告警系统:系统告警通知和查看
- 交互功能:时间范围选择、数据刷新、告警查看
3. 数据模型设计
3.1 数据结构定义
仪表板的数据模型设计是实现的基础。我们定义了以下数据结构:
// 仪表板数据结构
export interface DashboardData {
    overview: Overview;         // 概览数据
    charts: Charts;            // 图表数据
    alerts: Alert[];           // 告警数据
}

// 概览数据
export interface Overview {
    totalUsers: number;        // 总用户数
    totalRevenue: number;      // 总收入
    totalOrders: number;       // 总订单数
    conversionRate: number;    // 转化率
    userGrowth: number;        // 用户增长率
    revenueGrowth: number;     // 收入增长率
    orderGrowth: number;       // 订单增长率
    conversionGrowth: number;  // 转化率增长
}

// 图表数据
export interface Charts {
    salesTrend: SalesTrend[];           // 销售趋势
    userDistribution: UserDistribution[]; // 用户分布
    topProducts: TopProduct[];          // 热销商品
    recentActivities: RecentActivity[]; // 最近活动
}

// 销售趋势数据
export interface SalesTrend {
    month: string;  // 月份
    value: number;  // 销售额
}

// 用户分布数据
export interface UserDistribution {
    category: string;  // 用户类别
    value: number;     // 占比值
    color: string;     // 显示颜色
}

// 热销商品数据
export interface TopProduct {
    name: string;    // 商品名称
    sales: number;   // 销量
    revenue: number; // 收入
}

// 最近活动数据
export interface RecentActivity {
    time: string;   // 时间
    user: string;   // 用户
    action: string; // 行为
    type: 'purchase' | 'register' | 'cart' | 'view' | 'payment'; // 类型
}

// 告警数据
export interface Alert {
    id: number;     // ID
    type: 'warning' | 'info' | 'error' | 'success'; // 类型
    message: string; // 消息
    time: string;    // 时间
    isRead: boolean; // 是否已读
}
3.2 状态管理设计
在组件中,我们使用 @State 装饰器来管理状态:
@Component
export struct DashboardGrid {
    // 仪表板数据
    @State dashboardData: DashboardData = { /* 初始数据 */ }

    // 其他状态
    @State selectedTimeRange: string = '今日'
    @State refreshing: boolean = false
    @State showAlerts: boolean = false

    // 时间范围选项
    private timeRanges: string[] = ['今日', '本周', '本月', '本季度', '本年']

    // 组件方法和构建函数...
}
4. 辅助功能实现
4.1 数据格式化
为了更好地展示数据,我们实现了几个数据格式化方法:
// 格式化数字
formatNumber(num: number): string {
    if (num >= 100000000) {
        return `${(num / 100000000).toFixed(1)}亿`
    } else if (num >= 10000) {
        return `${(num / 10000).toFixed(1)}万`
    } else if (num >= 1000) {
        return `${(num / 1000).toFixed(1)}k`
    }
    return num.toString()
}

// 格式化百分比
formatPercentage(num: number): string {
    const sign = num >= 0 ? '+' : ''
    return `${sign}${num.toFixed(1)}%`
}
4.2 样式辅助方法
我们还实现了一些辅助方法来动态设置样式:
// 获取增长趋势颜色
getGrowthColor(growth: number): string {
    return growth >= 0 ? '#34C759' : '#FF3B30'
}

// 获取告警图标
getAlertIcon(type: string): Resource {
    switch (type) {
        case 'error':
            return $r('app.media.01')
        case 'warning':
            return $r('app.media.02')
        case 'success':
            return $r('app.media.03')
        default:
            return $r('app.media.04')
    }
}

// 获取告警颜色
getAlertColor(type: string): string {
    switch (type) {
        case 'error':
            return '#FF3B30'
        case 'warning':
            return '#FF9500'
        case 'success':
            return '#34C759'
        default:
            return '#007AFF'
    }
}
4.3 数据刷新
实现数据刷新功能:
// 刷新数据
refreshData() {
    this.refreshing = true
    // 模拟数据刷新
    setTimeout(() => {
        this.refreshing = false
        console.log('数据刷新完成')
    }, 2000)
}
5. 页面结构设计
5.1 整体布局
仪表板的整体布局采用 Stack 和 Column 组合:
build() {
    Stack() {
        Column() {
            // 顶部标题栏
            // ...

            // 仪表板网格
            // ...
        }
        .width('100%')
        .height('100%')

        // 告警对话框
        if (this.showAlerts) {
            // ...
        }
    }
    .width('100%')
    .height('100%')
}
5.2 顶部标题栏
顶部标题栏包含标题、时间范围选择、告警按钮和刷新按钮:
// 顶部标题栏
Row() {
    Column() {
        Text('数据仪表板')
            .fontSize(24)
            .fontWeight(FontWeight.Bold)
            .fontColor('#333333')

        Text('实时监控业务数据')
            .fontSize(14)
            .fontColor('#666666')
            .margin({ top: 4 })
    }
    .alignItems(HorizontalAlign.Start)
    .layoutWeight(1)

    Row() {
        // 时间范围选择
        Button(this.selectedTimeRange)
            .fontSize(14)
            .fontColor('#007AFF')
            .backgroundColor('rgba(0, 122, 255, 0.1)')
            .borderRadius(16)
            .padding({ left: 12, right: 12, top: 6, bottom: 6 })
            .margin({ right: 8 })

        // 告警按钮
        Button() {
            Stack({ alignContent: Alignment.TopEnd }) {
                Image($r('app.media.big15'))
                    .width(24)
                    .height(24)
                    .fillColor('#333333')

                if (this.dashboardData.alerts.filter(alert => !alert.isRead).length > 0) {
                    Circle({ width: 8, height: 8 })
                        .fill('#FF3B30')
                        .margin({ top: -2, right: -2 })
                }
            }
        }
        .width(40)
        .height(40)
        .borderRadius(20)
        .backgroundColor('#F0F0F0')
        .margin({ right: 8 })
        .onClick(() => {
            this.showAlerts = true
        })

        // 刷新按钮
        Button() {
            Image($r('app.media.big20'))
                .width(24)
                .height(24)
                .fillColor('#333333')
                .rotate({ angle: this.refreshing ? 360 : 0 })
                .animation({
                    duration: 1000,
                    iterations: this.refreshing ? -1 : 1,
                    curve: Curve.Linear
                })
        }
        .width(40)
        .height(40)
        .borderRadius(20)
        .backgroundColor('#F0F0F0')
        .onClick(() => {
            this.refreshData()
        })
    }
}
.width('100%')
.padding({ left: 16, right: 16, top: 16, bottom: 16 })
.backgroundColor('#FFFFFF')
6. 仪表板网格实现
6.1 Grid 组件配置
仪表板的核心是使用 Grid 组件来布局各个数据卡片:
// 仪表板网格
Grid() {
    // 概览数据卡片
    // ...

    // 销售趋势图
    // ...

    // 用户分布图
    // ...

    // 热销商品
    // ...

    // 最近活动
    // ...
}
.columnsTemplate('1fr 1fr')  // 两列等宽布局
.rowsGap(12)                 // 行间距
.columnsGap(12)              // 列间距
.width('100%')
.layoutWeight(1)
.padding({ left: 16, right: 16, bottom: 16 })
.backgroundColor('#F8F8F8')
6.2 GridItem 配置
使用 GridItem 组件来定位每个卡片的位置:
// 概览数据卡片
GridItem() {
    this.OverviewCard('总用户数', this.dashboardData.overview.totalUsers,
        this.dashboardData.overview.userGrowth, $r('app.media.big19'))
}
.columnStart(0)  // 从第0列开始
.columnEnd(0)     // 到第0列结束(占据第1列)

GridItem() {
    this.OverviewCard('总收入', this.dashboardData.overview.totalRevenue,
        this.dashboardData.overview.revenueGrowth, $r('app.media.big11'))
}
.columnStart(1)  // 从第1列开始
.columnEnd(1)     // 到第1列结束(占据第2列)

// 跨列的图表
GridItem() {
    this.ChartCard('销售趋势', () => {
        this.SalesTrendChart()
    })
}
.columnStart(0)  // 从第0列开始
.columnEnd(1)     // 到第1列结束(占据2列)
6.3 卡片组件实现
6.3.1 概览卡片
// 概览卡片组件
@Builder
OverviewCard(title: string, value: number, growth: number, icon: Resource, isPercentage: boolean = false) {
    Column() {
        Row() {
            Image(icon)
                .width(24)
                .height(24)
                .fillColor('#007AFF')

            Blank()

            Column() {
                Text(this.formatPercentage(growth))
                    .fontSize(12)
                    .fontColor(this.getGrowthColor(growth))
                    .textAlign(TextAlign.End)

                Image(growth >= 0 ? $r('app.media.big1') : $r('app.media.big2'))
                    .width(12)
                    .height(12)
                    .fillColor(this.getGrowthColor(growth))
            }
            .alignItems(HorizontalAlign.End)
        }
        .width('100%')
        .margin({ bottom: 12 })

        Text(isPercentage ? `${value}%` : this.formatNumber(value))
            .fontSize(24)
            .fontWeight(FontWeight.Bold)
            .fontColor('#333333')
            .width('100%')
            .textAlign(TextAlign.Start)
            .margin({ bottom: 4 })

        Text(title)
            .fontSize(14)
            .fontColor('#666666')
            .width('100%')
            .textAlign(TextAlign.Start)
    }
    .width('100%')
    .padding(16)
    .backgroundColor('#FFFFFF')
    .borderRadius(12)
    .shadow({
        radius: 6,
        color: 'rgba(0, 0, 0, 0.1)',
        offsetX: 0,
        offsetY: 2
    })
}
6.3.2 图表卡片
// 图表卡片组件
@Builder
ChartCard(title: string, content: () => void) {
    Column() {
        Text(title)
            .fontSize(16)
            .fontWeight(FontWeight.Bold)
            .fontColor('#333333')
            .width('100%')
            .textAlign(TextAlign.Start)
            .margin({ bottom: 16 })

        content()
    }
    .width('100%')
    .padding(16)
    .backgroundColor('#FFFFFF')
    .borderRadius(12)
    .shadow({
        radius: 6,
        color: 'rgba(0, 0, 0, 0.1)',
        offsetX: 0,
        offsetY: 2
    })
}
7. 图表与数据可视化
7.1 销售趋势图
使用简化的柱状图展示销售趋势:
// 销售趋势图
@Builder
SalesTrendChart() {
    Column() {
        // 简化的柱状图
        Row() {
            ForEach(this.dashboardData.charts.salesTrend, (item:SalesTrend, index) => {
                Column() {
                    // 柱子
                    Column()
                        .width(20)
                        .height((item.value / 350000) * 100)
                        .backgroundColor('#007AFF')
                        .borderRadius({ topLeft: 4, topRight: 4 })
                        .margin({ bottom: 8 })

                    // 月份标签
                    Text(item.month)
                        .fontSize(10)
                        .fontColor('#666666')
                        .textAlign(TextAlign.Center)

                    // 数值
                    Text(this.formatNumber(item.value))
                        .fontSize(8)
                        .fontColor('#999999')
                        .textAlign(TextAlign.Center)
                        .margin({ top: 2 })
                }
                .alignItems(HorizontalAlign.Center)
                .layoutWeight(1)
            })
        }
        .width('100%')
        .height(120)
        .alignItems(VerticalAlign.Bottom)
    }
}
7.2 用户分布图
使用简化的饼图展示用户分布:
// 用户分布饼图
@Builder
UserDistributionChart() {
    Row() {
        // 简化的饼图(使用圆形进度条模拟)
        Stack() {
            Circle({ width: 80, height: 80 })
                .fill('#F0F0F0')

            Circle({ width: 60, height: 60 })
                .fill('#FFFFFF')

            Text('用户\n分布')
                .fontSize(10)
                .fontColor('#666666')
                .textAlign(TextAlign.Center)
        }
        .margin({ right: 16 })

        // 图例
        Column() {
            ForEach(this.dashboardData.charts.userDistribution, (item:UserDistribution) => {
                Row() {
                    Circle({ width: 8, height: 8 })
                        .fill(item.color)
                        .margin({ right: 8 })

                    Text(item.category)
                        .fontSize(12)
                        .fontColor('#666666')
                        .layoutWeight(1)

                    Text(`${item.value}%`)
                        .fontSize(12)
                        .fontWeight(FontWeight.Bold)
                        .fontColor('#333333')
                }
                .width('100%')
                .margin({ bottom: 8 })
            })
        }
        .layoutWeight(1)
    }
    .width('100%')
}
7.3 数据列表
7.3.1 热销商品列表
// 热销商品列表
@Builder
TopProductsList() {
    Column() {
        ForEach(this.dashboardData.charts.topProducts.slice(0, 3), (product:TopProduct, index) => {
            Row() {
                Text(`${index + 1}`)
                    .fontSize(14)
                    .fontWeight(FontWeight.Bold)
                    .fontColor(index === 0 ? '#FFD700' : index === 1 ? '#C0C0C0' : '#CD7F32')
                    .width(20)

                Column() {
                    Text(product.name)
                        .fontSize(12)
                        .fontColor('#333333')
                        .maxLines(1)
                        .textOverflow({ overflow: TextOverflow.Ellipsis })
                        .width('100%')
                        .textAlign(TextAlign.Start)

                    Text(`销量: ${product.sales}`)
                        .fontSize(10)
                        .fontColor('#666666')
                        .margin({ top: 2 })
                }
                .alignItems(HorizontalAlign.Start)
                .margin({ left: 12 })
                .layoutWeight(1)

                Text(this.formatNumber(product.revenue))
                    .fontSize(12)
                    .fontWeight(FontWeight.Bold)
                    .fontColor('#FF3B30')
            }
            .width('100%')
            .padding({ top: 8, bottom: 8 })
            .border({
                width: { bottom: index < 2 ? 1 : 0 },
                color: '#F0F0F0'
            })
        })
    }
}
7.3.2 最近活动列表
// 最近活动列表
@Builder
RecentActivitiesList() {
    Column() {
        ForEach(this.dashboardData.charts.recentActivities.slice(0, 4), (activity:RecentActivity, index) => {
            Row() {
                Image(this.getActivityIcon(activity.type))
                    .width(16)
                    .height(16)
                    .fillColor('#007AFF')
                    .margin({ right: 8 })

                Column() {
                    Text(`${activity.user} ${activity.action}`)
                        .fontSize(12)
                        .fontColor('#333333')
                        .maxLines(1)
                        .textOverflow({ overflow: TextOverflow.Ellipsis })
                        .width('100%')
                        .textAlign(TextAlign.Start)

                    Text(activity.time)
                        .fontSize(10)
                        .fontColor('#999999')
                        .margin({ top: 2 })
                }
                .alignItems(HorizontalAlign.Start)
                .layoutWeight(1)
            }
            .width('100%')
            .padding({ top: 8, bottom: 8 })
            .border({
                width: { bottom: index < 3 ? 1 : 0 },
                color: '#F0F0F0'
            })
        })
    }
}
8. 告警系统实现
8.1 告警对话框
// 告警对话框
@Builder
AlertsDialog() {
    Column() {
        Row() {
            Text('系统告警')
                .fontSize(18)
                .fontWeight(FontWeight.Bold)
                .fontColor('#333333')
                .layoutWeight(1)

            Button() {
                Image($r('app.media.search_icon'))
                    .width(20)
                    .height(20)
                    .fillColor('#666666')
            }
            .width(32)
            .height(32)
            .borderRadius(16)
            .backgroundColor('#F0F0F0')
            .onClick(() => {
                this.showAlerts = false
            })
        }
        .width('100%')
        .margin({ bottom: 16 })

        Column() {
            ForEach(this.dashboardData.alerts, (alert:Alert) => {
                Row() {
                    Image(this.getAlertIcon(alert.type))
                        .width(20)
                        .height(20)
                        .fillColor(this.getAlertColor(alert.type))
                        .margin({ right: 12 })

                    Column() {
                        Text(alert.message)
                            .fontSize(14)
                            .fontColor('#333333')
                            .width('100%')
                            .textAlign(TextAlign.Start)

                        Text(alert.time)
                            .fontSize(12)
                            .fontColor('#999999')
                            .margin({ top: 4 })
                    }
                    .alignItems(HorizontalAlign.Start)
                    .layoutWeight(1)

                    if (!alert.isRead) {
                        Circle({ width: 8, height: 8 })
                            .fill('#FF3B30')
                    }
                }
                .width('100%')
                .padding(12)
                .backgroundColor(alert.isRead ? '#FFFFFF' : '#F8F8F8')
                .borderRadius(8)
                .margin({ bottom: 8 })
                .onClick(() => {
                    alert.isRead = true
                })
            })
        }
        .width('100%')
        .height(300)
    }
    .width('90%')
    .padding(20)
    .backgroundColor('#FFFFFF')
    .borderRadius(16)
}
8.2 告警显示
在主界面中显示告警对话框:
// 告警对话框
if (this.showAlerts) {
    Column() {
        this.AlertsDialog()
    }
    .width('100%')
    .height('100%')
    .backgroundColor('rgba(0, 0, 0, 0.5)')
    .justifyContent(FlexAlign.Center)
    .onClick(() => {
        this.showAlerts = false
    })
}
9. Grid 组件在仪表板中的优势
| 优势 | 描述 |
|---|---|
| 灵活的布局 | Grid 组件支持灵活的行列定义,可以轻松创建复杂的网格布局 |
| 精确的位置控制 | 通过 columnStart、columnEnd 等属性可以精确控制每个卡片的位置 |
| 响应式布局 | 可以使用 fr 单位创建响应式布局,适应不同屏幕尺寸 |
| 间距控制 | 通过 rowsGap 和 columnsGap 可以统一控制网格间距 |
| 嵌套能力 | 可以在 GridItem 中嵌套其他布局组件,构建复杂界面 |
10. 仪表板卡片设计技巧
| 技巧 | 描述 |
|---|---|
| 视觉层次 | 使用阴影、边框和背景色创建视觉层次,突出重要信息 |
| 颜色编码 | 使用颜色编码表示不同状态(如增长为绿色,下降为红色) |
| 数据格式化 | 对大数据进行格式化(如 1.2万、3.5k),提高可读性 |
| 图标使用 | 使用图标增强视觉效果,提高信息识别度 |
| 交互反馈 | 为按钮和卡片添加点击效果,提供良好的交互体验 |
11. 总结
本教程详细讲解了如何使用 HarmonyOS NEXT 的 Grid 组件实现企业级仪表板界面。通过合理的数据模型设计、模块化的组件构建和灵活的网格布局,我们打造了一个功能完善、布局合理的仪表板界面。
Grid 组件的强大布局能力使得我们能够轻松实现复杂的仪表板布局,而模块化的设计思想则使得代码更加清晰和可维护。在实际开发中,开发者可以根据具体需求,灵活运用 Grid 组件,创建出更加丰富多样的仪表板界面。
在下一篇教程中,我们将深入探讨仪表板网格布局的进阶技巧,包括动态调整网格结构、高级交互效果和性能优化等内容,敬请期待!
- 0回答
- 5粉丝
- 0关注
- 185.[HarmonyOS NEXT 实战案例十:Grid] 仪表板网格布局进阶篇
- 175.[HarmonyOS NEXT 实战案例七:Grid] 嵌套网格布局基础篇:打造企业级仪表板界面
- 160.[HarmonyOS NEXT 实战案例二:Grid] 照片相册网格布局:基础篇
- 172.[HarmonyOS NEXT 实战案例六:Grid] 响应式网格布局 - 基础篇
- 166.[HarmonyOS NEXT 实战案例四:Grid] 可滚动网格布局基础篇
- 169.[HarmonyOS NEXT 实战案例五:Grid] 动态网格布局基础篇
- 178.[HarmonyOS NEXT 实战案例八:Grid] 瀑布流网格布局基础篇
- [HarmonyOS NEXT 实战案例十] 电子书网格布局(下)
- [HarmonyOS NEXT 实战案例十] 电子书网格布局(上)
- 163.[HarmonyOS NEXT 实战案例三:Grid] 不规则网格布局基础篇:打造新闻应用首页
- 171.[HarmonyOS NEXT 实战案例五:Grid] 动态网格布局高级篇
- 162.[HarmonyOS NEXT 实战案例二:Grid] 照片相册网格布局:高级篇
- 168.[HarmonyOS NEXT 实战案例四:Grid] 可滚动网格布局高级篇
- 174.[HarmonyOS NEXT 实战案例六:Grid] 响应式网格布局 - 高级篇
- 180.[HarmonyOS NEXT 实战案例八:Grid] 瀑布流网格布局高级篇
